by Randy Martin, Office of Sustainability
If you have seen the dark smoke billow out of the exhaust of a tractor-trailer or have had your windows down behind an older vehicle that coughs its way forward, you’ve seen firsthand the pollution that a single vehicle can produce. Now imagine all of that, a few hundred million times over, across the globe.
According to the EPA, transportation accounts for about 27% of US greenhouse gas emissions. Specifically, Internal Combustion Engines, or ICE vehicles, contribute to not only climate change but increased air pollution, which causes negative health effects such as heart and respiratory disease as well as cancer. Often these health effects are more prominent in lower-income communities and communities of color. Additionally, the extraction, refinement, and transportation of petro-fuels cause damage to ecosystems, trample indigenous sovereignty, and bolster corrupt governments.
Even though, at present, the outlook of transportation looks grim, it is one of the lowest hanging fruits on our solutions tree. Through sustainable modes of transportation, it is possible to avoid many of these negative externalities. Many sustainable alternatives such as walking, cycling, electric vehicles, zero-emissions vehicles, and public transport provide savings, and boost the local economy.
STARS1 has identified transportation as a key area for improving sustainability metrics within institutions. Additionally, sustainable transportation connects with United Nations Sustainable Development Goals:
- 3: Good Health and Wellbeing
- 9: Industry, Innovation, and Infrastructure
- 11: Sustainable Cities and Communities
- 12: Responsible Consumption and Production
- 13: Climate Action
Subcategories
Within STARS the subcategory of Transportation is divided into three credit areas: Campus Fleet, Commute Modal Split, and Support for Sustainable Transport.
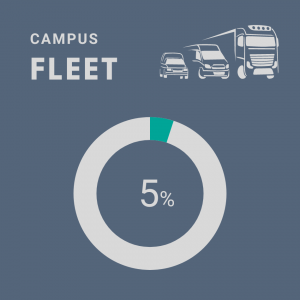 Campus Fleet: Schools using zero-emission and fuel-efficient vehicles earn points in this subcategory. It is measured as a percentage of alternatively powered vehicles vs traditional internal combustion engines.
Auburn’s Score: .050/1
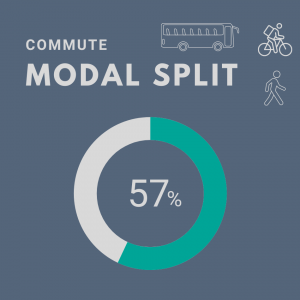 Commute Modal Split: This credit is awarded to schools based on the percentage of students and faculty that use alternative means of transportation (Ie. Not use a single-occupancy vehicle) to get to and from the institution.
Auburn’s Score: 2.84/5
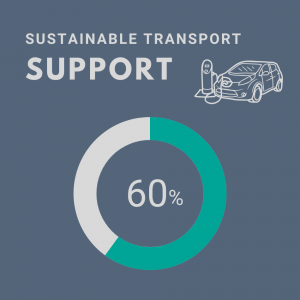 Support for Sustainable Transport: Institutions’ efforts to incentivize and encourage students to use more sustainable means of transportation earn them recognition in this area. Some examples might include showers for bike commuters
or preferred parking for electric vehicles.
Auburn’s Score: 0.60/1
Reflections
We have seen relative success in the student body’s adoption of sustainable modes of transportation. Over 60% of students walk, cycle, or use public transit. The bus fleet is partially comprised of hybrid-electric buses easily locatable via the Transloc app. These buses help reduce local pollution and are easily accessible for students. Additionally, several departments on campus provide incentives to use sustainable modes of transportation such as reduced rate parking permits for those that carpool, prime park and recharge locations for plug-in electric vehicles, bike racks outside of almost all buildings on campus, and well-maintained, on-campus biking infrastructure. Lastly, the Office of Sustainability has an online transportation guide that helps students and employees incorporate sustainable modes of transport into their commute.
While we are making headway, we have plenty of room to improve. Two simpler challenges to face might be our campus fleet and employee commuting.
Beginning with our campus fleet, out of the 1,097 vehicles owned by Auburn University, 59 are 100% electric. As department vehicles need to be replaced, purchasing an electric vehicle should be a significant consideration.
Employees lag far behind the student body in adopting sustainable modes of transportation. 87% of employees commute in a single-occupancy vehicle. There are countless ways this could be improved, but a few options might be: further reducing the cost of carpool parking passes, providing additional premium carpool parking, subsidizing ride-share options, partnering with local governments to expand bus transit routes to include more local areas, and hiking rates of single-occupancy vehicle parking.
Action
Here are actions you can take to increase the adoption of sustainable transport models on campus and beyond.
- Personal – Bike, walk and carpool as much as possible and check out our Sustainable Transport Guide.
- Local- Consider using Lee-Russell Public Transit.https://www.lrcog.com/
- National – Encourage your department, school, company, or institution to sign up for the national challenge, Cycle September.
- Global – Consider supporting an international charity that expands transportation access to those in need.
¹The Sustainability Tracking, Assessment, and Rating System (STARS) program is a self-reporting framework for institutions of higher education to track their sustainability performance created by the Association for the Advancement of Sustainability in Higher Education. Overall, STARS is made up of 211 possible points in 64 different subcategories. The subcategories are grouped by Academics, Engagement, Operations, and Planning & Administration. Additionally, participants may receive extra points for exemplary and innovative practices. In this summary, our score is shown over the amount of possible points for each credit. View Auburn University’s 2022 STARS Report for more details.
Learn about the SDGs & AU and our contributions related to this post.

